Factors Favoring A Challenging Winter Across New England
BOSTON (CBS) - We never issue a winter seasonal forecast in October because November is a very telling month for the winter ahead.
Clearly, it is a bellwether because Boston statistics reveal that Novembers with below average mean temperatures of a degree or more yield forthcoming winters with snowfall at or above average.
The average snowfall for the city is 43.5 inches. There are only a couple of exceptions to this rule as seen in data from the past 25 years. Also note the so-called blow torch Novembers of 3 degrees or more above average in temperature resulted in winters with much less snowfall than average
November Mean Temperature Winter Snowfall
1992 -2.3 Degrees 1992-93 83.9"
1993 +0.3 Degrees 1993-94 96.3"
1994 +3.7 Degrees 1994-95 14.9"
1995 -3.4 Degrees 1995-96 107.6"
1996 -5.0 Degrees 1996-97 51.9"
1997 -3.6 Degrees 1997-98 25.6" (El Nino)
1998 -0.7 Degrees 1998-99 36.4"
1999 +2.7 Degrees 1999-00 24.9"
2000 -1.5 Degrees 2000-01 45.9"
2001 +3.0 Degrees 2001-02 15.1"
2002 -2.0 Degrees 2002-03 70.9"
2003 +1.0 Degrees 2003-04 39.4"
2004 -0.5 Degrees 2004-05 86.6"
2005 +1.0 Degrees 2005-06 39.9"
2006 +4.2 Degrees 2006-07 17.1"
2007 -1.9 Degrees 2007-08 51.2"
2008 -1.5 Degrees 2008-09 65.9"
2009 +4.0 Degrees 2009-10 35.7"
2010 -0.1 Degrees 2010-11 81.0"
2011 +5.7 Degrees 2011-12 9.3"
2012 -2.6 Degrees 2012-13 63.4"
2013 -2.0 Degrees 2013-14 58.9"
2014 -2.2 Degrees 2014-15 110.6"
2015 +3.9 Degrees 2015-16 36.1"
2016 +1.5 Degrees 2016-17 47.6"
We just experienced the second warmest October on record with a mean temperature an astonishing +7.4 degrees! It almost tied the #1 slot for warmest October ever on record established in 1947. In that year, November flipped very cold with the mean temperature of -3.5 degrees! The winter of 1947-48 produced a whopping 89.2 inches of snow! Based upon the weather pattern projection for the next two weeks, below average temperatures are anticipated on many but not all of the remaining days of the month. Consequently, the current mean temperature around -1.5 degrees may end up close to or lower than -2 degrees. It could certainly be a clue for winter 2017-18.
With that said, we need to examine a myriad of other global factors that influence winter. There are a couple dozen drivers that create the flavor of the season. When they are all in sync, higher forecast confidence results. The problem is the atmosphere and oceans are in a state of flux so the trick is determining how these drivers may change or oscillate throughout the season.
Some of the most important factors are the ENSO states meaning El Nino or La Nina. This season is featuring a weak to perhaps moderate La Nina. Stats dating back to near 1950 reveal that most weak La Ninas resulted in near to slightly above average seasonal snowfall. Again, there are a couple exceptions to that rule. Moderate La Nina winters had above average snowfall with one exception.
Winter Snowfall
1954-55 25.1"
1955-56 60.9" (Moderate La Nina)
1964-65 50.4"
1970-71 57.3" (Moderate La Nina)
1971-72 47.5"
1974-75 46.6"
1983-84 43.0"
1984-85 26.6"
1995-96 107.6" (Moderate La Nina)
2000-01 45.9"
2005-06 39.9"
2008-09 65.9"
2011-12 9.3" (Moderate La Nina)
2016-17 47.6"
Seasonal forecasting has become more intriguing over the years as we gain a greater understanding of the amazing connectivity between the oceans and the atmosphere. A very important tool in winter forecasting is the locations of warmer and cooler than average sea surface temperatures called warm and cool pools. These pools tend to dictate the overlying configuration of the jet stream.
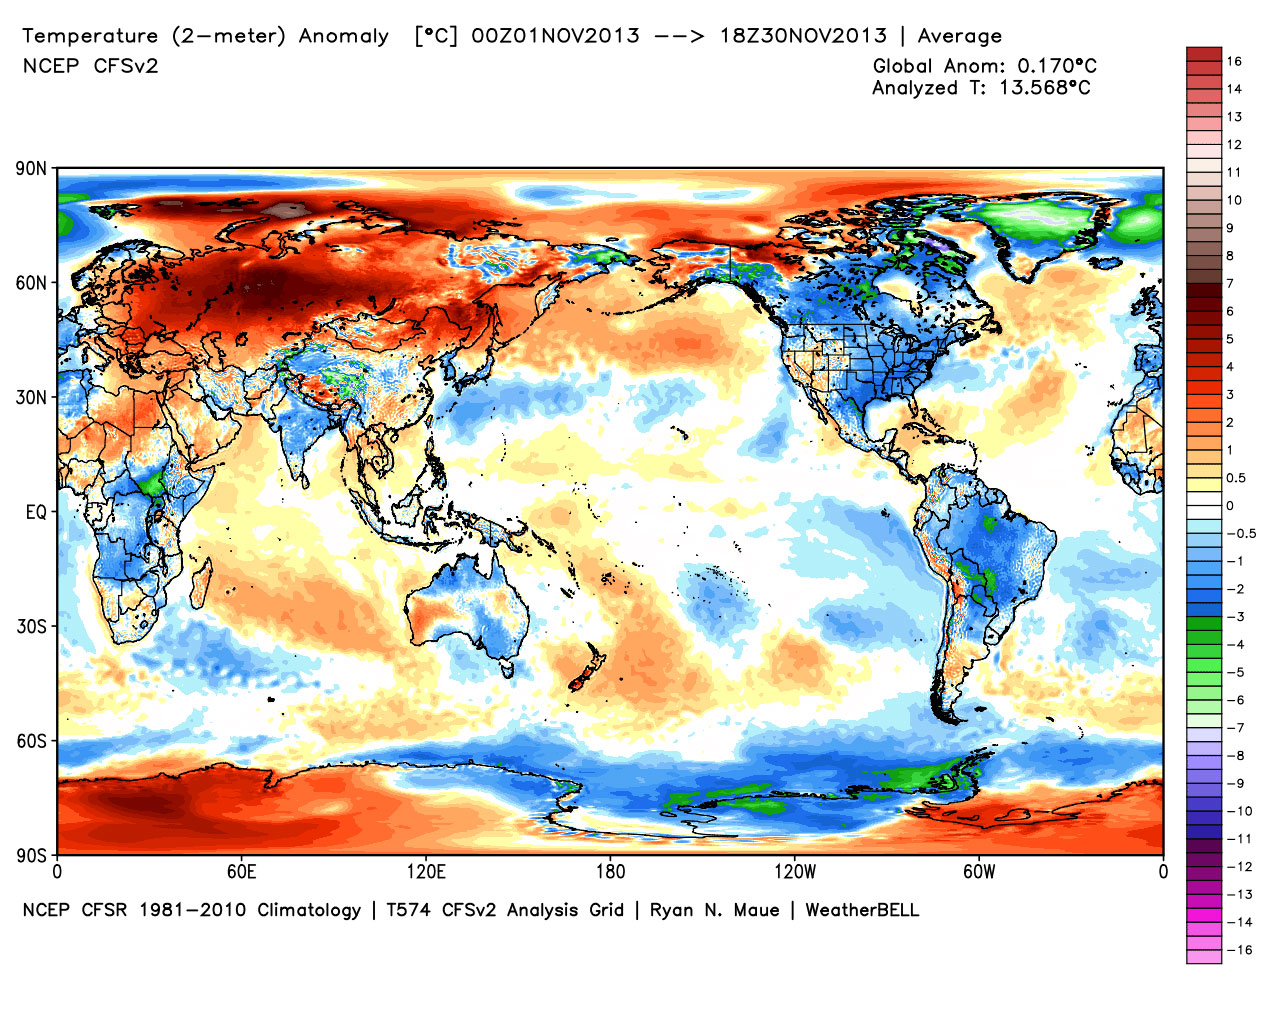
Compare these 2 images of the temperature regime noting especially the locations of the warm and cool pools over the oceans especially the Pacific Ocean. There is a developing and expanding warm pool south of the Aleutians this fall which is similar to the pattern of 2013.
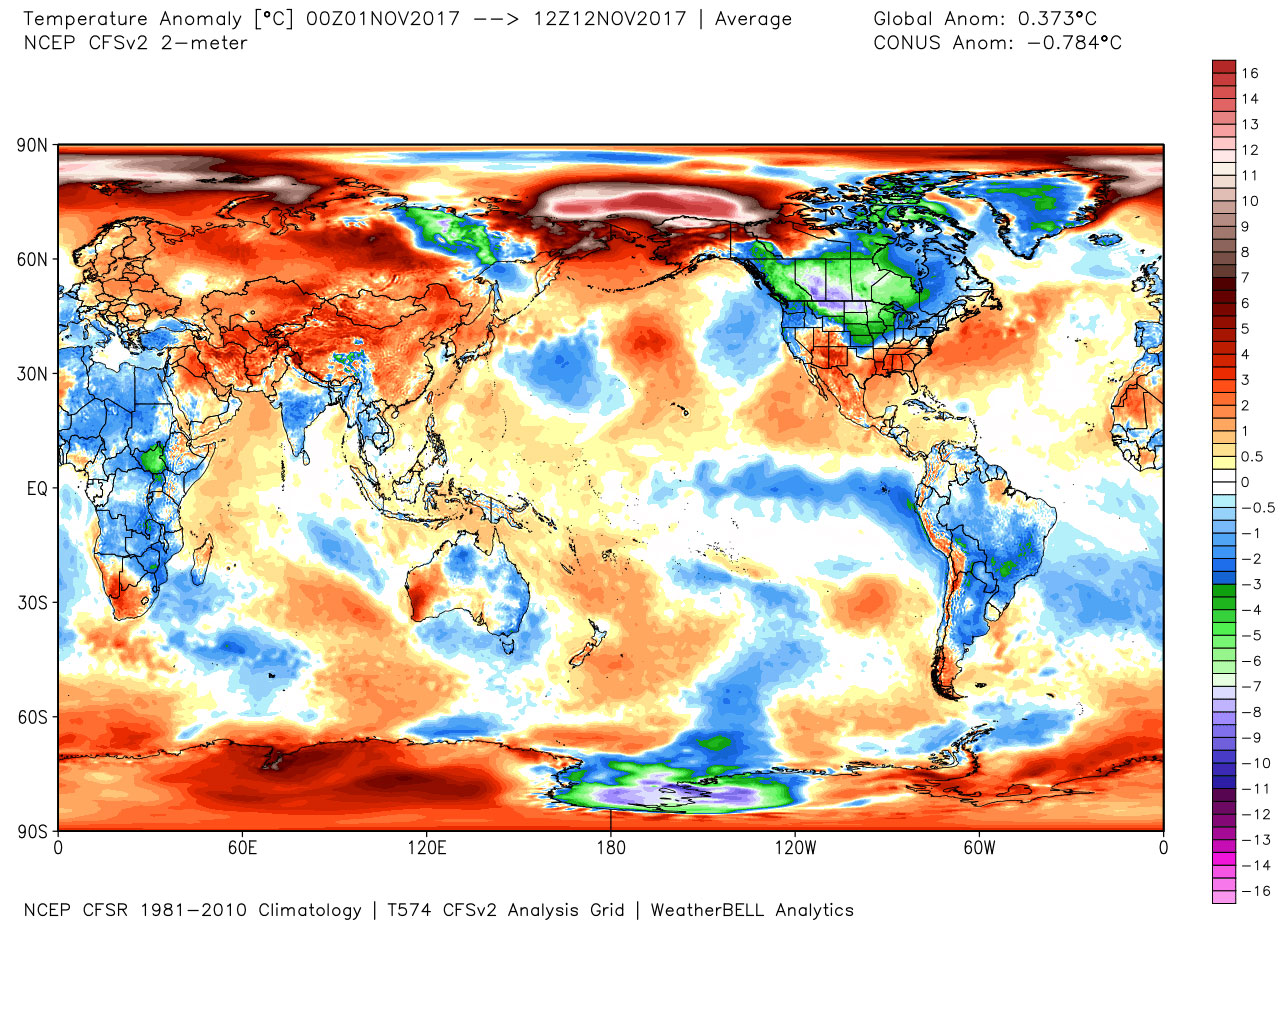
That is a signal favoring eventual ridging in the eastern Pacific and downstream troughing over the eastern states. It is a cold signal for the Canadian Rockies east-southeastward into the northern and central plains into the Midwest, Great Lakes and Northeast. The warm pool west of Baja California favors colder than average weather over the east, the strip of cooler water biased over the eastern equatorial Pacific associated with the La Nina plus the warmer than average water off the East Coast favors colder than average weather over Canada and the northern border states.
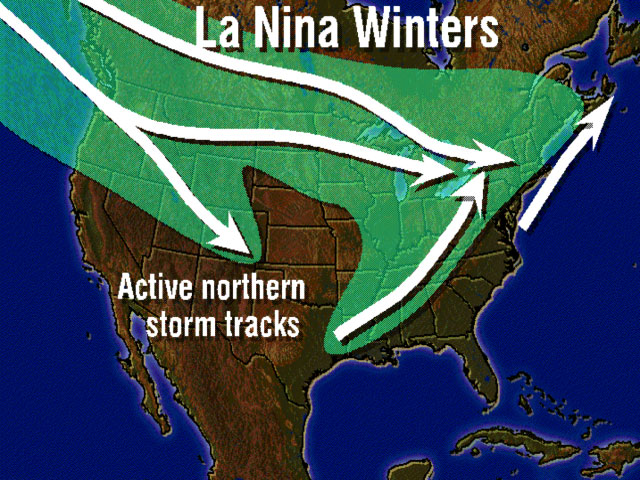
Weak La Ninas tend to produce a season of variability with the main storm exhibiting clippers emerging from the Canadian Rockies southeastward into the Midwest. From here, varying tracks can produce inside runners, coastal huggers or offshore wingers which can make or break the snowfall forecast for the coastal plain. The heart of the winter snows tend to fall from the Great Lakes to northern New England but a lot will depend upon high latitude blocking.
The accuracy of seasonal weather prediction has improved significantly over the years thanks to the work of brilliant scientists in and out of the government sector. They have identified a myriad of global factors that influence seasonal climate forecasting for various locations. These include ENSO, the NAO, the PDO, the PNA, the EPO, the TNA, the AMO. the MJO, the QBO, etc. The permutations in the phases of these numerous oscillations, the solar cycle, geomagnetic activity, recent volcanism, storm track data, fall temperature and precipitation patterns plus the extent of autumn snow cover from Eurasia into western Canada and ice coverage in the Arctic sea all play a role.

The rather obscure QBO can be an important contributor to the seasonal weather. The Quasi-Biennial Oscillation is a slow oscillation in the direction and strength of the zonal wind in the lower and middle stratosphere over the equator. It has a period of about 28-29 months. The alternating wind regime between easterly and westerly develops at the top of the lower stratosphere and propagates downward about 0.6 miles per month until dissipated in the tropical tropopause. The amplitude of the easterly phase is about twice as strong as the westerly phase. The easterly phase is taking place this winter and the easterly phase favors higher pressure in high latitudes yielding more blocking in what is called a negative Arctic Oscillation and/or negative North Atlantic Oscillation. These blocking episodes are tough to forecast months in advance but the presence of the easterly QBO makes it more likely during a portion of the season. Consequently, blocking episodes would tend to cause the weakening of primary storms running into the interior Northeast and promoting secondary storm development along the coast increasing the chances of more snow or perhaps ice storms typical in a La Nina setup.
One more potential factor to incorporate into this winter's forecast is the ACE Index. ACE is the Accumulated Cyclone Energy which is a measure used by NOAA to express the activity of individual tropical cyclones and entire tropical cyclone seasons. It uses an approximation of the wind energy used by a tropical system over its lifetime and is calculated every 6 hours. The ACE of a season is the sum of the ACE for each storm and takes into account the number, strength and duration of all tropical storms in the season. 2017 was ranked #7 in terms of all-time Total ACE in the Atlantic Basin. Analog years yielded warm to very warm Octobers (like 2017), cooling in November, colder than average December into 1st half January leading to moderation into February then a cold, harsh March. I don't consider this as a high-ranking factor but it is interesting to see how analog years of other high ACE years unfolded. Most but not all of the winters following high ACE years featured near to above average snowfall
In conclusion: It is a tough call on approximate amounts near the coast. Variations in storm tracks obviously will make or break the prediction. For now, I am forecasting 45-55" BOS building up north & west to 75" central MA and northward. Ski resorts up north have a good shot for a snow bonanza. On the flip, lower totals of 30-45" southeastern MA to 15-30" Cape Cod.
My gut feeling is that these amounts are too conservative! We shall see.