BPL Exhibit Explores 500 Years Of Mapping Weather
BOSTON (CBS) - If you're looking for something to do this summer, the Boston Public Library has a new, free exhibit that exposes everyone to centuries-old weather wisdom.
In "Regions and Seasons: Mapping Climate through History," you can explore how weather and climate data has been mapped over the last 500 years. The collection has 200,000 maps and 5,000 atlases.
You can see some big names from the history of cartography in this show.
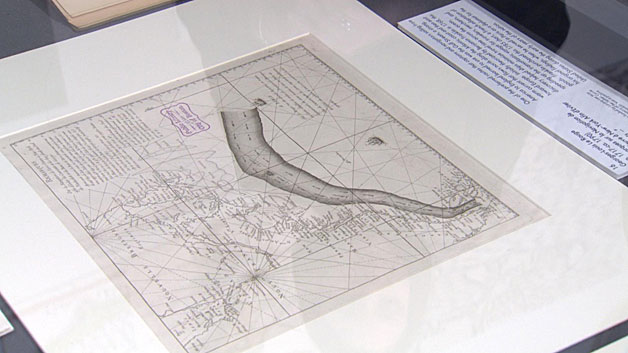
For example, the Gulf Stream was first charted by Ben Franklin and Timothy Folger in 1785 in Paris.
"As the story goes, Ben Franklin was asking his cousin Timothy Folger who was a captain, and he said 'Why does it always take so much longer for ships to come back to America from England than it does for them to get there?' and he said, 'Well, you're hitting the Gulf Stream," said Stephanie Cyr, the assistant curator of the Leventhal Map Center.
Claudius Ptolemy's "Geographia," his world map from 1511, is also part of the display.
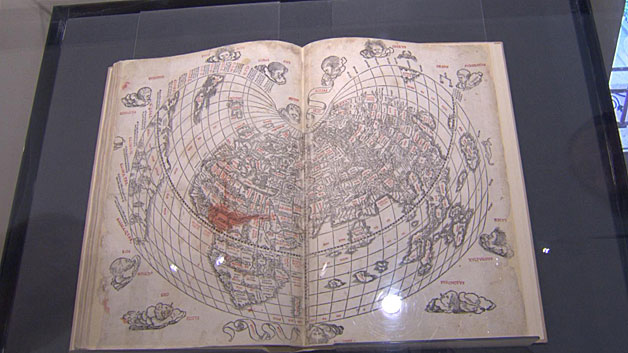
"The winds were originally named by Aristotle in the fourth century," Cyr told WBZ, as she described the map. "They were personifications, people thought of them as Gods who really dictated what was happening as far as the atmosphere was concerned."
The display of tornadoes, hurricanes, oceans, agriculture, precipitation, temperature, and vegetation helps relate weather history to forecasting today.
"We have our elements that make up weather. You can learn about pressure, precipitation, and temperature, and when those combine you can see examples of hurricanes and tornadoes," says Cyr.
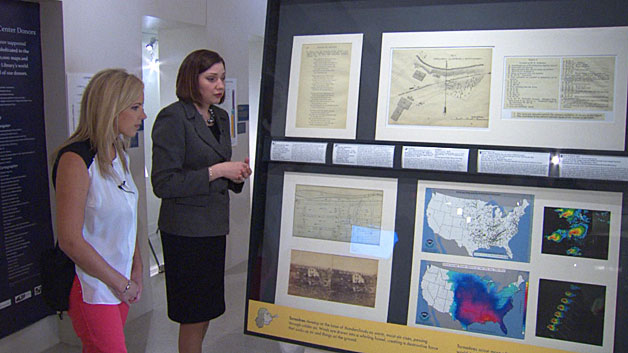
Tornadoes are difficult to map. In fact, back in the 1820's poems were written about them after they struck.
By 1835 people began surveying the damage from a tornado and recording it.
The maps in this exhibit show the progression of how they improved over the years. Now they're digitally produced.
"We're able to, by tracking instances or occurrences of tornadoes throughout certain areas over a period of time, we're able to see patterns and understand relationships better which allows us to prepare for the future," says Cyr.
"We've come a long way from writing poems."
The exhibit also has a display of our climate forecast, specifically for Boston and cities along the coast.
"Regions and Seasons: Mapping Climate through History" is open through August 27 at the Boston Public Library.
If you can't make it to the museum, you take a virtual 3D tour here.