Eye On Weather: Hurricane Season Outlook
BOSTON (CBS) - Before we dig into this hurricane season outlook, let me point out a key aspect of it: The number of storms doesn't particularly matter. Why? Because it only takes one. And that's ridiculously cliché and you've heard it a million times. But when it comes to hurricanes, it couldn't be more true and it bears repeating over and over again. Like a frustrating Red Sox game, you can have tons of base hits (storms) but leave a lot of runners on base (out to sea). So it goes with some hurricane seasons.
Read: More 'Eye on Weather' Stories
There are seasonal outlooks for the number of storms (and their strength) every year, and those outlooks have started to get pretty good over the years. We're learning more and more about the drivers of tropical seasons and what causes rises and falls in activity. I'd expect our ability to predict well into the future will only get better over time. However, we still don't have much skill in where exactly all those storms will go. And that's really the key, isn't it? Even if we, or the National Hurricane Center, or the Weather Channel, or Colorado State University etc., could nail the number of storms that will organize and receive names this year, the important part is knowing when and where they'll make landfall. And the science isn't quite there yet.
So all that being said, there are lots of factors that go into an outlook, and even some that can help tell us where the storms may head. And just the exercise of talking about the season is a good way to get people thinking about the potential and hopefully put preparedness plans in place. That's really the goal of any meteorologist – to educate people on the power of weather and how to limit risk to life and property. Without further ado, here are the variables at play and some takeaways before the season officially begins on June 1st!
Before We Start – Hurricane Climatology
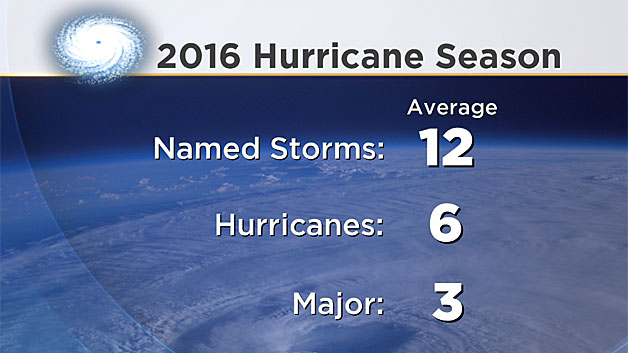
So what's 'typical' when it comes to the Atlantic season? On average, there are 12 named storms, 6 of which become hurricanes, and 2-3 of which reach 'Major' Category 3 or higher status.
Below is a look at the criteria for the different stages of a tropical system.
- Tropical Depression: A tropical cyclone with maximum sustained winds of 38 mph (33 knots) or less.
- Tropical Storm: A tropical cyclone with maximum sustained winds of 39 to 73 mph (34 to 63 knots).
- Hurricane: A tropical cyclone with maximum sustained winds of 74 mph (64 knots) or higher. In the western North Pacific, hurricanes are called typhoons; similar storms in the Indian Ocean and South Pacific Ocean are called cyclones.
- Major Hurricane: A tropical cyclone with maximum sustained winds of 111 mph (96 knots) or higher, corresponding to a Category 3, 4 or 5 on the Saffir-Simpson Hurricane Wind Scale.
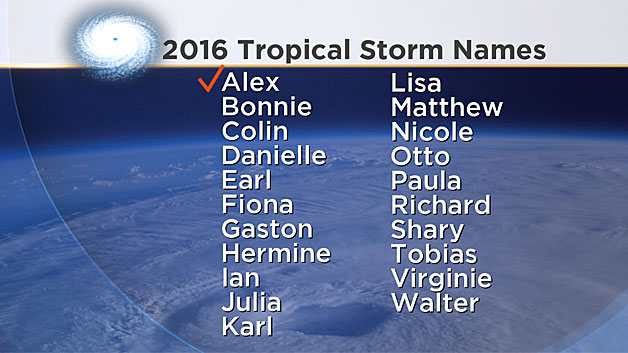
The season officially runs from June 1st through November 30th, but that doesn't mean a storm can't form outside of that window. Case in point, this past winter! We saw Alex form in January, becoming the first January hurricane in the Atlantic since 1955.
There have been named storms in May, and named storms in December. But when you really talk about the heart of the season, it's mid-August through mid-October. This is the peak time for tropical activity where the vast majority of storms have formed. Wind shear is still light and the water is warm. Perfect conditions for a hurricane.
When it comes to the names, there's an interesting history.
Starting in 1947, the Air Force Hurricane Office in Miami used the phonetic alphabet (Able-Baker-Charlie-etc.). There was a bit of confusion that developed when multiple storms were ongoing, and so women's names were given to tropical storms starting in 1953. There are no 'male' storm names from this time until 1979, when the NHC made the move to a list that alternated between male and female storm names. And that's where we are today! The WMO (World Meteorological Organization) is in charge of the names and maintains 6 rotating lists. That means every 6 years, the same list repeats. The exception to this is when a storm name is retired because it is particularly damaging and/or deadly. There will never be another Sandy, Katrina, Andrew, etc.
It's also interesting to note that even though the Atlantic season can go through busy years and quiet years, global activity is almost always the same. Over the course of a year, the planet sees about 100 tropical cyclones. The overall number of storms is very stable. When a couple basins are very active, there is a corresponding decrease in activity in other basins. The planet is good at balancing things out!
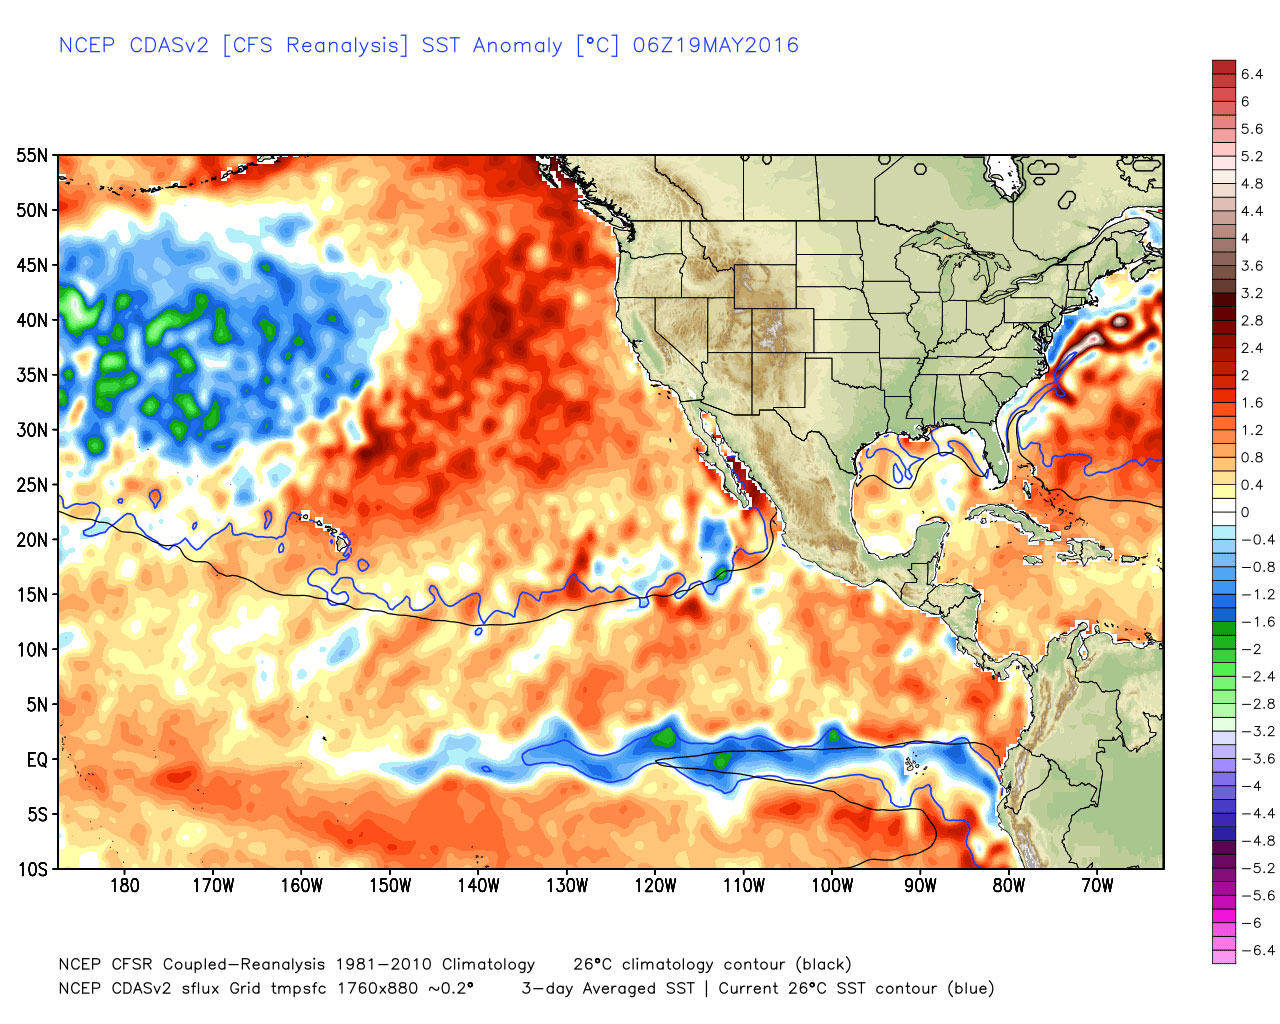
Factor 1 – El Nino Is Gone, Here Comes La Nina
After months of 'Godzilla El Nino' headlines and a big impact on our past winter, El Nino is gone. In fact, the ocean has already cooled so much that we're on our way to La Nina. A ribbon of below average SSTs has developed across the equatorial Pacific in a place that saw near-record levels for warm water in winter. This has large implications for hurricane activity.
In 2015, we saw an eastern Pacific hurricane season that was absolutely on fire. A tremendous parade of intense hurricanes marched off the coast of the Americas, feasting on this warm water. At the same time, El Nino helps to dramatically increase wind shear over the Caribbean and Gulf of Mexico in the Atlantic. The few storms we saw attempt to enter that bear cage got immediately shredded. This is why you'll essentially always see lower Atlantic hurricane forecasts during El Nino years.
This year, we expect La Nina to have taken up residence by late summer or early fall. This takes out an element of wind shear that put the lid on development in 2015. So that's a factor in favor of storms.
Factor 2 – The Atlantic Multi-decadal Oscillation
Any casual observer of weather knows that it works in cycles. The reasons for these cycles are not always known. For instance, there are several large scale ocean patterns that shift on decadal time scales, and we're really not sure what drives them at this point. We simply know that they exist, and that they have significant global implications. The PDO (Pacific Decadal Oscillation) is one of these, which we'll get to in a minute. Another is the AMO, which we have a little more understanding of. It's phase is often tied in to changes in the thermohaline circulation, which is a huge current bringing warm tropical water northward and returning cold water southward back to the tropics. Warm (+) phases of the AMO represent intervals of faster thermohaline circulation. Cold (-) phases of the AMO represent intervals of slower thermohaline circulation.
When the AMO is positive (+), warm water pools in the Atlantic. Sea-surface temperatures move higher than average, which in turn offers more energy for any developing tropical systems. When it is negative (-), the opposite is true. Colder water from the North Atlantic spreads toward the tropics, taking away some of that potential energy. Each phase tends to last 20-40 years. Taking a glimpse at the last century or so, it's easy to spot these different eras.
When we had a strong +AMO era from the 30s through the early 60s, it was a veritable bonanza of hurricanes (and strong ones at that). This stretch is nearly unfathomable when compared to the meager activity these days. There were 14 Category 4 or 5 hurricanes which made landfall in the U.S. from 1926 to 1969. Only 3 such storms have made landfall since. This stretch featured the Long Island Express (Hurricane of '38), Carol, Edna, Diana, Connie, and Donna here in New England. Florida was raked with major hurricanes at an unrelenting pace. To be sure, such a stretch today would lead to hundreds of billions of dollars in losses.
Then the AMO went negative, and activity in the Atlantic decreased dramatically in the 70s, 80s, and early 90s. Once we moved back to a +AMO in the mid-90s, we entered the most recent active era. And now here we are again, watching the cycle flip. Indications are that a new –AMO regime started a few years ago in the Atlantic, perhaps in 2013. It will take a couple more years to know if this flip has definitively taken up residence and a period of inactivity has begun, but the timing is right and we're seeing record –AMO levels at this time. The odds of landfall decrease significantly along the East Coast during –AMO regimes, while odds actually increase slightly for the Gulf Coast states.
Keep in mind this important point – there are still hurricanes during 'quiet' periods. And there are still STRONG hurricanes during these times. It's just that the overall volume decreases.
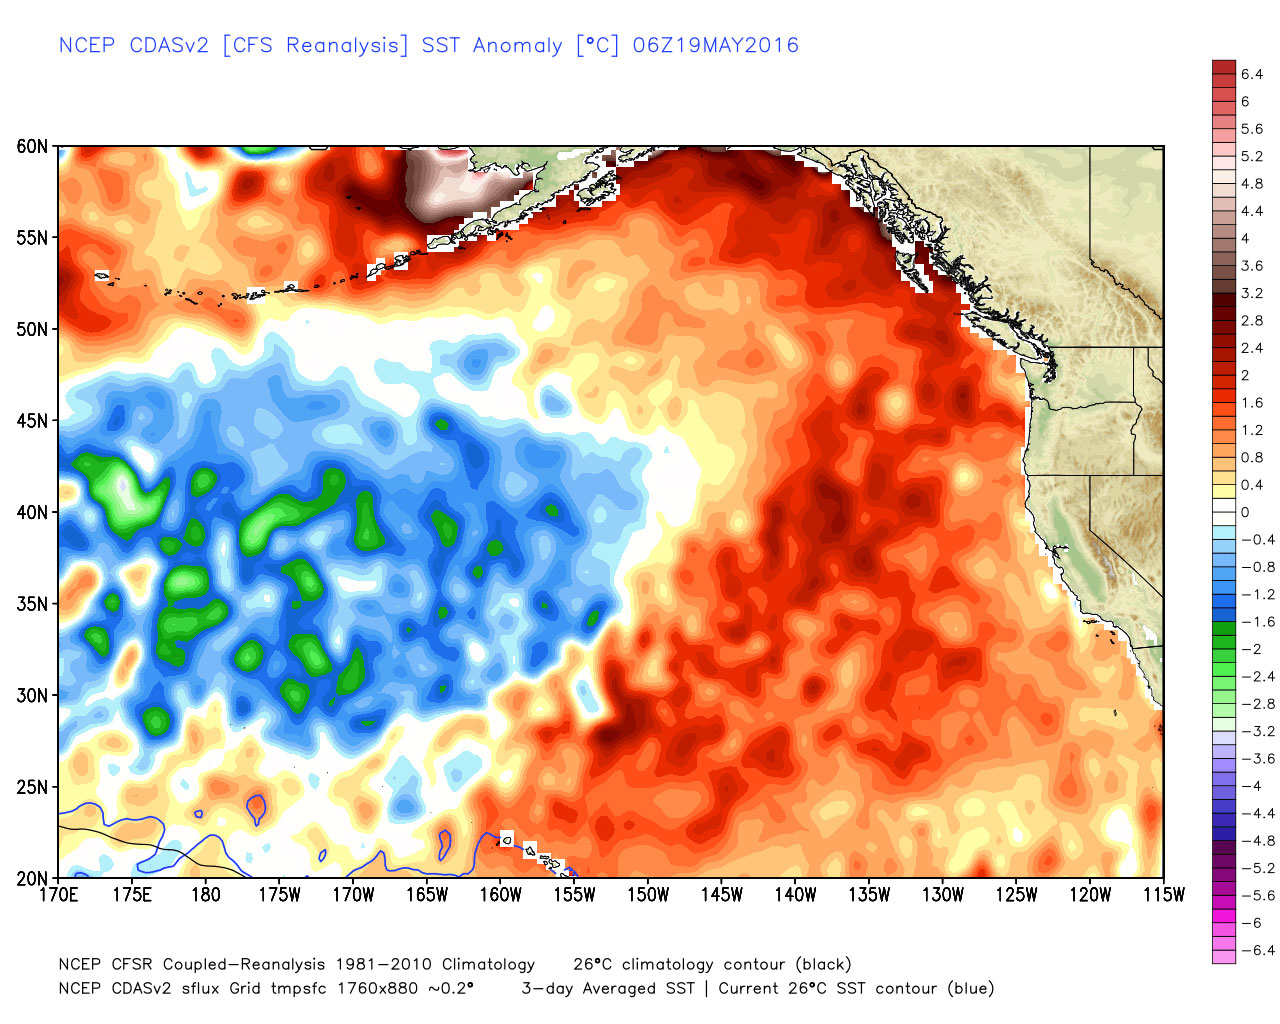
Factor 3 – Will the Pacific Decadal Oscillation Shield Us Again?
Yet another large-scale ocean pattern, the PDO, may help us out on the East Coast. The PDO is yet another oscillation that operates on a decadal time scale. It was predominantly in a negative phase from 1998 until 2013, but has recently shown a strong positive tendency. Combined with El Nino, it's a significant contributor to the extreme global warmth we've seen late in 2015 and early in 2016.
A record +PDO for April was just observed, which is also a big part of the reason Alaska and the Pacific Northwest has been seeing exceptional warmth. A +PDO means that warmer than average water is ringing the coast of western North America up toward Alaska, with cooler than average water out across the northern Pacific. This type of setup tends to produce ridging of the jet stream over western North America, which in turn can send a trough downstream over the Midwest/Northeast.
One thing we've seen a lot of in recent years is summertime troughing along the East Coast, which favors storms recurving out to sea. So even when there are storms lurking, a large portion have headed out over the Atlantic as the jet stream winds push them east. Of course there are exceptions to this rule, like Sandy and Irene. At any given time the steering currents can open a window to landfall. But the troughing has certainly protected us more than it has hurt us.
While the summer outlook is for above average temperatures, we are keeping an eye on this PDO situation. Certainly we could end up with more cooler air than expected coming down from Canada this summer, and I think our prospects for a real scorcher are diminishing. The same setup that can deliver these bouts of cooler air could also help keep hurricanes away. So we will put the +PDO, which will likely linger into the summer, in the unfavorable for New England strikes column.
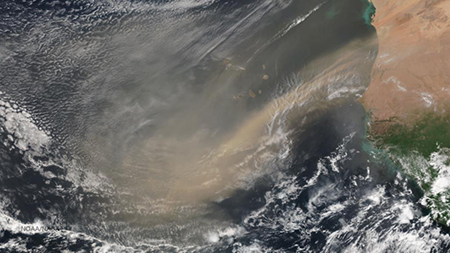
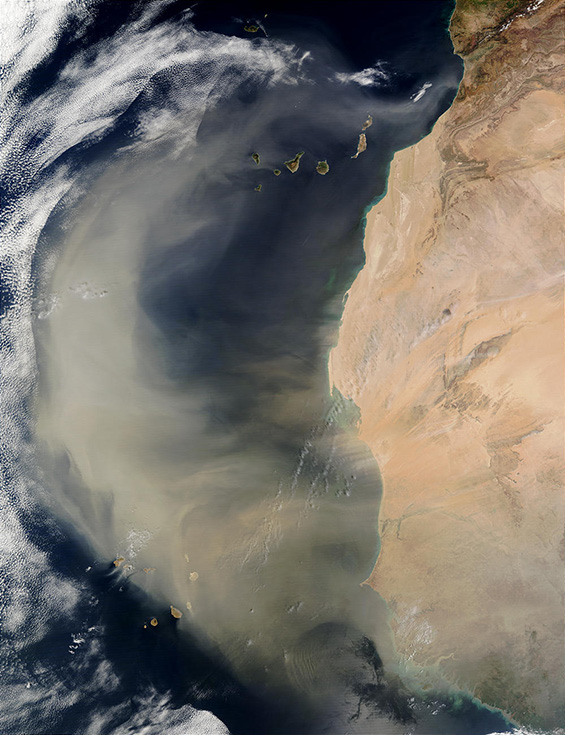
Factor(s) 4/5 – Saharan Dust and the MJO
These are wild cards in a way, and tougher to predict well in advance. In some seasons, we see tremendous amounts of Saharan dust blow out over the Atlantic, sometimes reaching the U.S. and Mexico. This dry and dusty air can help to inhibit storm development, even when the water is warm and shear is weak. It's a variable that we focus on more in the short-term (a week or two in advance) than we do months out.
The MJO, or Madden-Julian Oscillation, is a tropical disturbance that moves around the globe with a cycle on the order of 30-60 days. Isn't it amazing how many cycles there are on this planet?! A lot to keep track of, and this is probably giving a good appreciation for the powers of nature at work on a daily basis. While the PDO, AMO, and El Nino are more or less stationary patterns…the MJO travels the world. It moves east, and also comes in 2 phases – an enhanced rainfall (convective) phase and a suppressed rainfall phase.
This is the perhaps the best variable to use to forecast tropical activity on 1-3 week time scales. When you know where a convective phase is headed, you can infer that tropical activity odds will increase (or conversely, decrease in a suppressed phase). The convective phase favors rising air, while the suppressed phase favors sinking air.
This far out, we don't really know how strong summer/autumn MJO pulses will be, and where exactly they'll line up. That's why it's less of a seasonal outlook indicator and more of an in-season tool. But it's a powerful tool when we get into the real teeth of the Atlantic season.
The Takeaway
Phew, that was a lot of atmospheric science!
What does it all mean?
I think we are headed toward an 'average' season that doesn't feature an unusually high number of storms but that does surpass the last few quiet seasons.
I'm also going to be lame and head right back up to the start of this article.
It. Takes. One.
We've had extremely quiet overall seasons with one catastrophic storm crashing ashore (like Andrew in 1992). Hurricane Bob hit New England during an inactive era and quiet season. We can talk about these factors, we can make good estimates of overall activity, but we can't yet really forecast impact. Especially when you consider how dramatically different impact is for a single storm based on geography. A powerful hurricane that hits rural south Texas has an infinitely lower impact than the same storm hitting Miami.
So prepare for the ONE that could strike.
MEMA has great resources on how to plan and what supplies to have on hand. You do not want to be that person running to the hardware store the day of a storm. You do not want to be that person with no gas when all the stations run out for a week. You do not want to be the person without a generator ready to provide power if it goes out for a long time. And you do not want to be cut off from your friends or family.
Taking some relatively simple steps to prepare and following evacuation orders when/if they're issued can help save you a lot of stress.
We can't stop hurricanes, but we can mitigate risk, both to our lives and our property, by being proactive.