Warmest Decade On Record For Boston Area
BOSTON (CBS) - The end of the decade is upon us. Yes, I know the mathematics crowd will respond loudly 'No sir! Not until the end of 2020!' But for the rest of us and the pop-culture world, no one is going to call 2020 the twenty-teens. So let us push aside our data differences and talk about what we saw here and around the world this decade.
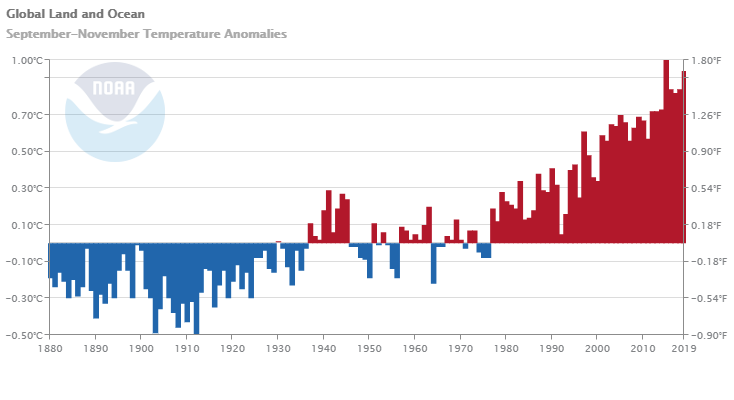
Of course, if you've been following along, you know that the 2010s were the warmest decade for the globe as a whole. The planet hasn't had a month cooler than the 20th century average since 1985, and we set new records for global warmth frequently as climate change continues to gradually push temperatures higher. The final numbers won't be crunched until later in January, but it is likely that 2019 will be the 2nd warmest year on record just a hair behind 2016. All of the Top 10 warmest years on record have occurred since 2005 with the exception of 1998, when a strong El Nino provided a significant short-term boost.
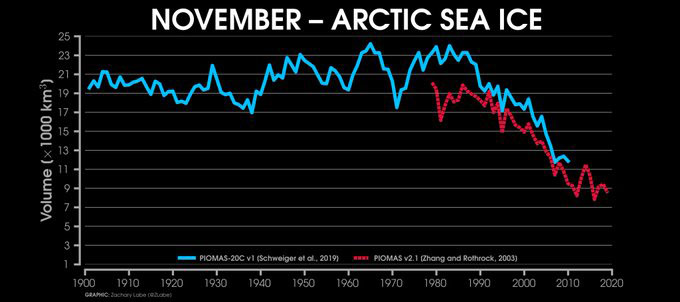
During this time, we have seen a major reduction in arctic sea ice with the 13 lowest extents in the satellite record (since 1979) occurring in the past 13 years. The dramatic loss of ice has produced major shifts in the arctic and influenced the weather down below (particularly during mid to late autumn when ice loss is most pronounced).
These rising temperatures are a product of human activities, primarily through the emissions of greenhouse gases and land use changes.
That's the big picture, but how about here at home? We are fortunate to have the oldest, continuously running climate station in the country right here in our backyard. Blue Hill Observatory has been sitting atop Great Blue Hill, meticulously recording and observing local weather, since 1885. Surrounded by forest and quality controlled by dedicated staff, it is our best resource for studying the changes over time across southern New England.
So what does it tell us? Like the global trend, Blue Hill Observatory is warming. And it did indeed have its warmest decade on record. The warmest year recorded there to this point is 2012. After that, 2016 which is followed by 2010. Also in the Top 10 standings are 2011 (8th) and 2017 (9th). In a world where warmth and colder times are equal, it would be nearly impossible to have 5 of the 9 warmest years of a 135-year climate record come in the same decade. But since the planet is warming, the odds are tilted in this direction every year now.
It is not just individual years. This decade brought the warmest of each of the seasons, the hottest overall month, and set new marks for 9 of the 12 individual months of the year.
• Warmest Year, 2nd warmest, 3rd warmest, 8th warmest, 9th warmest
• Warmest Overall month
• Warmest Winter
• Warmest Spring
• Warmest Summer
• Warmest Fall
• Every warmest month except January, March, and June
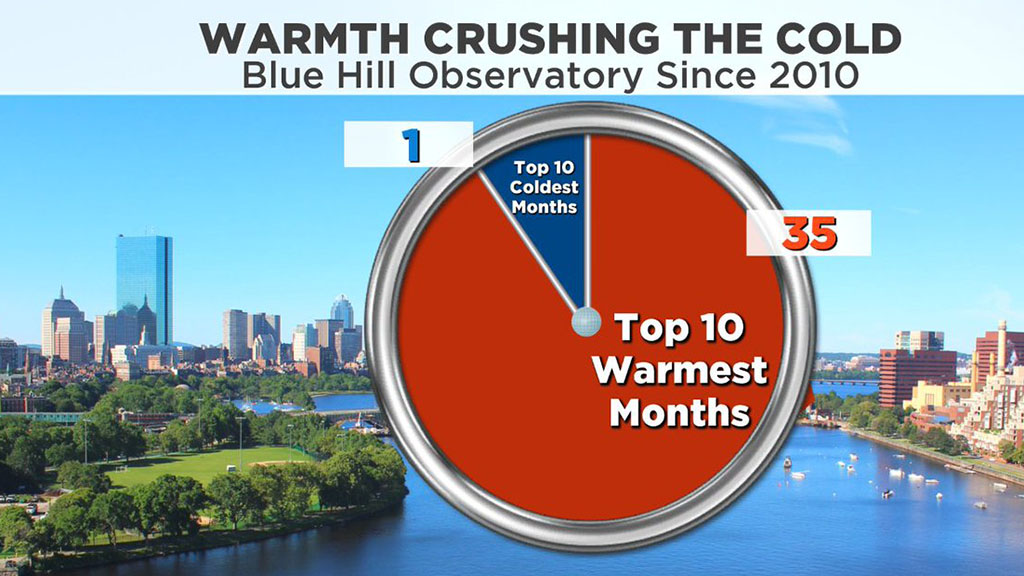
The graphic that I show most often that makes this trend the most clear is the number of 'Top 10 warmest' vs 'Top 10 coldest' months notched over the course of the 2010s. The ratio is 35 to 1. The only month over the past 10 years that landed as a Top 10 coldest on record was February of 2015 when we were buried by snow and locked in arctic chill.
That month was exceptional, but it's pretty easy to see that this has become the exception itself and not the rule. We are entrenched in mild/warm spells much more frequently than we are cold ones now, which is a trend that will likely continue into the 2020s.
Another way of looking at it is the ratio of daily records. These are just calendar day records for a given date, and the ratio is strongly in favor of warmth. This decade set record highs to lows at a rate of 57 to 17. There is an even more pronounced warming at night, with the ratio being 74 to 9 in favor of warmest lows to coldest lows.
Daily Lows: Record Warm vs Cold
2010s: 74/61
2000s: 38/29
1990s: 34/28
1980s: 27/37
1970s: 27/23
1960s: 17/17
1950s: 21/21
1940s: 25/29
1930s: 21/26
1920s: 25/26
1910s: 33/29
1900s: 14/16
1890s: 10/14
At this point perhaps there are still some skeptical people, and I get that. These are all just numbers on a thermometer recorded by humans, and there is always an element of imperfection. This is why I like to point toward biological markers around us, which also show the observed trend is correct.
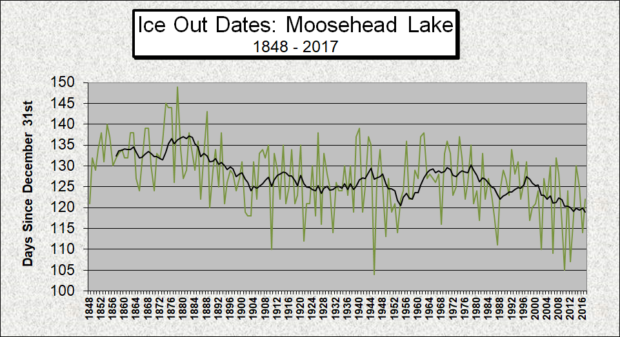
For instance, we keep track of things like when fruit ripens and when ice grows/leaves our lakes and ponds. We have seen the date of the first ripe blueberries creep up over time. We've seen ice-in dates come later and ice-out dates arrive earlier. It's not just a Boston area thing near the city. My go-to graph is of Moosehead Lake in rural northern Maine and it shows the same as what we have down here.
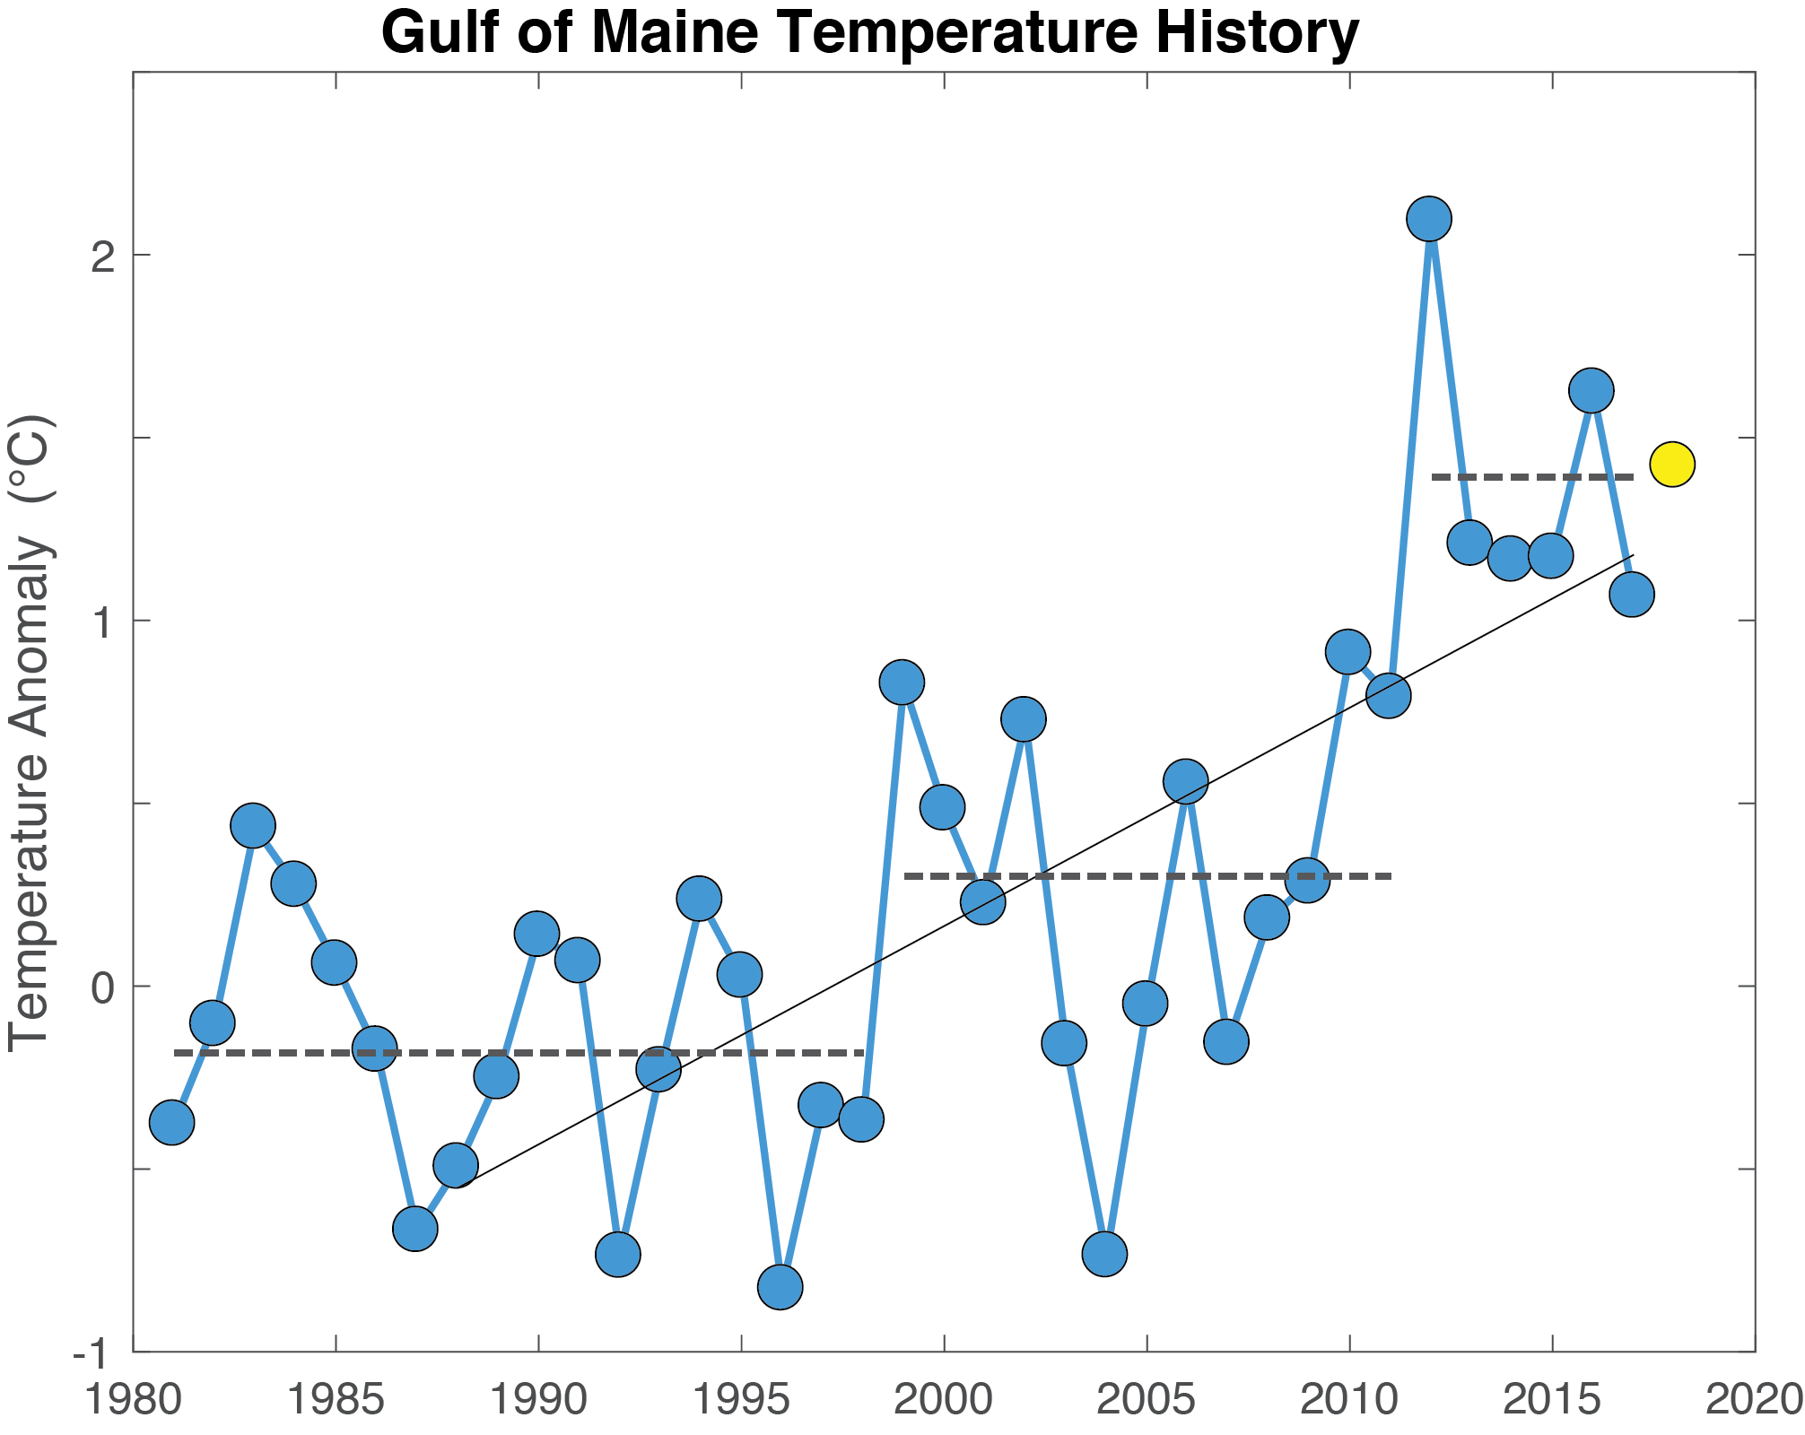
In the water, we have seen lobster habitat shift significantly north toward the Gulf of Maine and Canada over the past several decades as the ocean warms up. The Gulf of Maine itself is warming faster than 99% of global oceans, which as a whole set a record for heat content this year.
New to the region is now the Lone star tick, taking up residence along the South Coast and Cape Cod thanks to fewer harsh winter temperatures. Tropical fish are showing up in the area more frequently, as are tropical turtles like the Kemp's-Ridley. The blue crab population is also on the rise in our waters as they head up from the Mid-Atlantic.
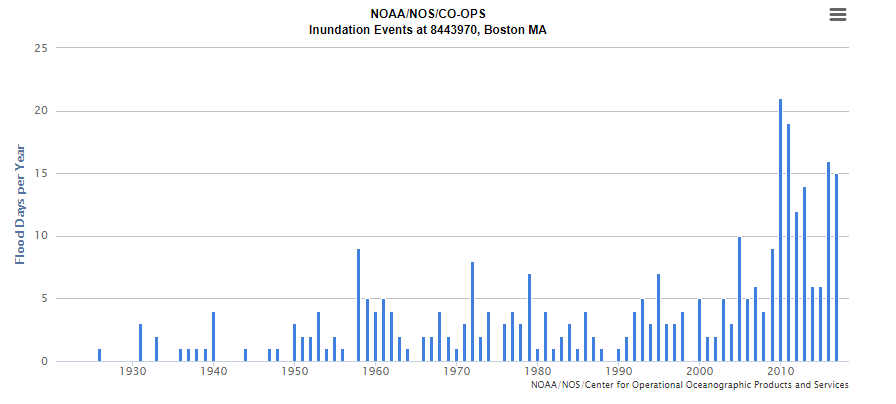
As for the water itself, it is sitting higher up. We've seen sea level increase about 1 foot in Boston over the past 100 years, which is enough to significantly increase 'sunny day flooding' and coastal inundation on days that don't even have a strong storm around. When we do have a strong storm and the timing lines up, it is easier to set new marks. We saw such an instance in January of 2018, with the highest water level on record in Boston surpassing the Blizzard of '78.
As you might expect, it is increasingly difficult to get a long, prime stretch of good conditions for winter sports. Of course it's not every year as there are regional differences year to year, season to season. That said, a study at Plymouth State has already found a 20% reduction in quality snowmaking days early in the season (through Christmas) and an 8.5% reduction over the season as a whole. This makes adaptation and better technology key in keeping our winter sports centers successful.
What does it all mean? Simply that we are living in a warmer time than those before us. Since emissions continue to rise, so will the global temperature. There is a good portion of future warming already 'baked in' even if we stopped today as CO2 lasts a long time in our atmosphere and much of that heat has already been storing up in our oceans.
But I do not see all doom and gloom ahead. Renewable energy continues to increase and people are making better choices for our environment. Humans are mostly clever and I think we'll be able to find solutions to whatever is ahead of us. It is also impossible to say that all warming is bad or all cooling is good for every point on the planet. So long as we work together and try to lessen our impact on the planet and plan for the future, I think there are successful times ahead for us. Well, until the asteroid, anyway.