Will The Snowiest Decade Continue?
BOSTON (CBS) -- Despite the snow blitz of 2015, many baby boomers still insist that, overall, we don't get the harsh bitter cold and deep snowy winters like we did in the good ole days.
Weather records prove that just isn't the case and despite the ongoing claims that snows are becoming rare and hurting winter sports, this millennium has been a blessing to snow lovers and winter sports enthusiasts.
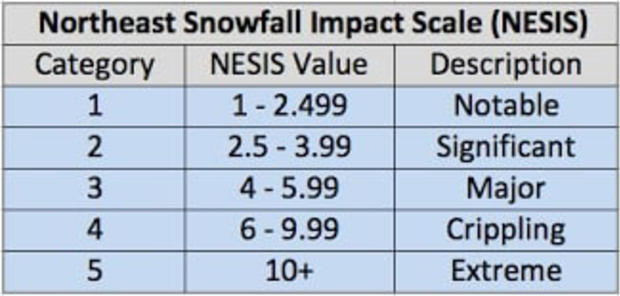
Just as the Saffir-Simpson and Fujita Scales were devised to categorize hurricanes and tornadoes, the Northeast Snowfall Impact Scale (NESIS) was created by Paul Kocin and Louis Uccellini of the National Weather Service to rank high-impact Northeast storms. This scale has 5 categories including extreme, crippling, major, significant and notable. In addition to meteorological measurements, the index uses population information which provides an indication of a storm's impacts on society. The NESIS scores are a function of the amount of snow, the area affected by the snowstorm and the number of people living in the path of the storm. The aerial distribution of snowfall and population information are combined in an equation that calculates a NESIS score which varies from around one for smaller storms to over 10 for extreme storms.
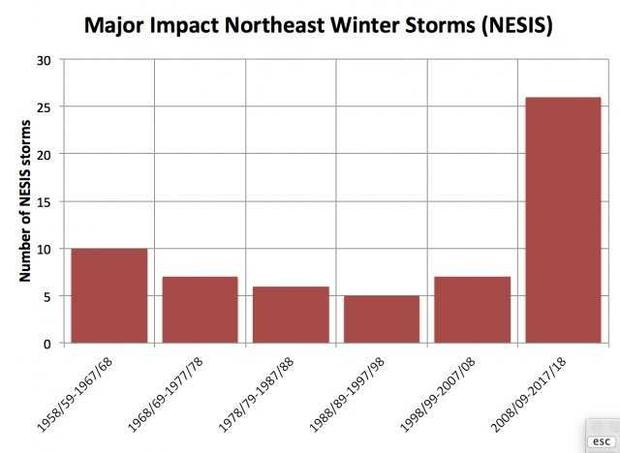
The last decade stands out like a sore thumb! It has had 29 major impact northeast winter storms with NO previous 10-year period with more than 10 storms! In Boston, 7 out of the last 10 years have produced snowfall above the average 43.7 inches.
2008-09: 65.9"
2009-10: 35.7"
2010-11: 81.0"
2011-12: 9.3"
2012-13: 63.4"
2013-14: 58.9"
2014-15: 110.6" Greatest On Record Back To 1872
2015-16: 36.1"
2016-17: 47.6"
2017-18: 59.9"
![NHemisSNOW[1]](https://assets1.cbsnewsstatic.com/hub/i/r/2018/11/15/e8a4e226-410f-4751-828f-5f2ba5280700/thumbnail/620x508/8958b68c510c29712d44f5284eb8dd83/nhemissnow1.jpg?v=63c131a0051f3823d92b0d1dffb5e0e4#)
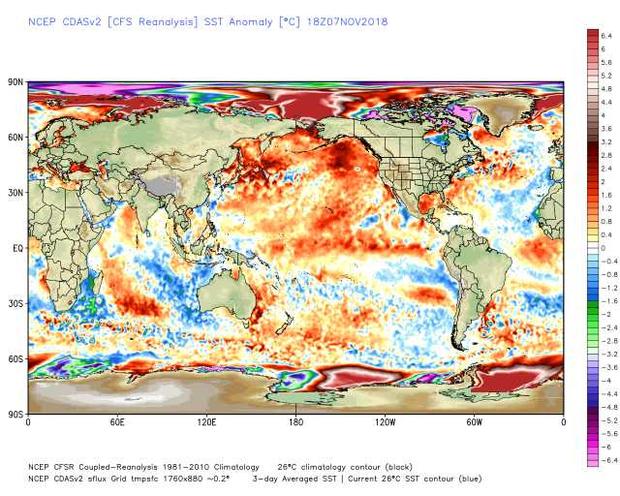
Additionally, the trend for fall snow across the northern hemisphere has been increasing, defying the forecasts over the last two decades for snows becoming an increasingly rare event. The 10-year running mean of the Boston area snowfall has skyrocketed to the highest level since snow records were kept and that goes back about 145 years! Fluctuations in the temperature regime and annual snowfalls are a function of about 25 global factors including changing oceanic oscillations mainly sea-surface temperature anomaly locations which impact atmospheric conditions creating certain jet stream configurations plus others such as solar activity and irradiance, geomagnetic activity, volcanism, etc.
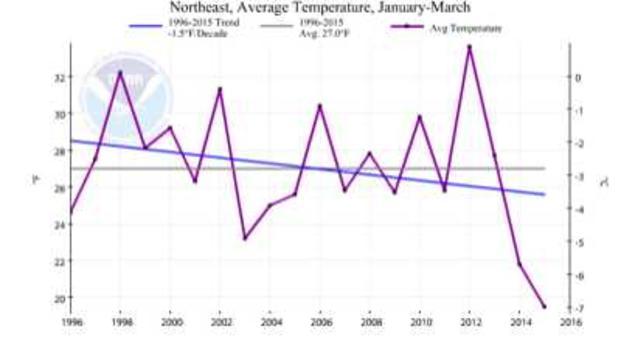
Interestingly, some scientists have stated that increasing snow is consistent with climate change because warmer air holds more moisture, more water vapor and this can result in more storms with heavy precipitation. The trick, of course, is having sufficient cold air to produce that snow. But note that 93% of the years with more than 60" of snow in Boston were colder than average years. The reality is cooling, not warming, increases snowfall. Note the graph depicting declining January through March temperatures for 20 years at a rate of 1.5 degrees F. per decade in the Northeast!
So, what gives? What can we expect going forward in the decades ahead? Are we indeed looking at a new paradigm? There is great uncertainty about the scope and prediction of climate change. Will there be a switch in direction? The Earth has experienced major cooling occurrences five times over the past 1000 years. When will the pendulum swing? Arctic temperatures and arctic ice extent varies in a predictable 60-70 year cycle. The greatest warming has been happening in the Arctic region and that can produce a weaker, less stable jetstream that allows frigid air to dive farther south to mix with the warmer oceans to trigger more potential snow events. It's all cyclical. Ocean cycles are driven by solar cycles. Above and beyond that, important drivers are the Earth's orbital cycles being comprised of such variables as the changes of the angle at which the Earth tilts on its axis plus the wobble of Earth on its axis. For now, we can be accurate in saying that the shorter range prediction of seasonal trends is more forecastable.