Why Some of The Mystery Is Gone
Find Eric Fisher on Twitter and Facebook
It's 1950. The phone rings and it's from the sheriff three towns over. He says there's a whole mess of trees down on a hillside, and it looks like a tornado came through. Later that day some crews head over and check it out. Looks like a lot of damage, there's a circular pattern to it, and a tornado looks like a good bet. The local paper puts it in their edition for the next day, and three states east it finally reaches the eyes and ears of people a day later. This is the way information passed decades ago.
Things have changed, to put it mildly! Cell phones are in most pockets. Cameras taking crystal clear photos are readily available. Internet connections are fast. And drones go airborne at the first sign of trouble. Twitter, Instagram, Facebook, 24/7 news cycle - if something happens you're going to hear about it. And that certainly applies to the weather. I don't think it's any mystery why many think the weather has turned insane on us in the past decade (even if we're at record lows for hurricanes, tornadoes, etc). You're blasted with these images from events you might never have even heard about 60 years ago!
The other big change comes in the way we monitor storms. It's a recent development, but the resolution of radar imagery across the country has improved dramatically. Dual-pol allows us to see into storms better than ever before. Their inner workings, the flow of air inside them, and even if they're full of debris as they travel along. Think of it this way - technology now allows you to go to a doctor. You tell her you're having chest pain. She has the tech to look inside your chest without opening it up, find a blockage, map it out, and perform surgery. This is where radar is heading. We can look into the depths of storms and see their working parts.
What's all this about? I couldn't help but notice the immediate reaction - both from regular Joes and elected/emergency officials alike - to think that a tornado struck Easthampton this morning. You can't blame them - there was tremendous damage! But what's even more interesting is that the tornado theory lingered out there all day even though there was nearly zero chance that a tornado could have touched down. In this day and age, that doesn't need to be the case.
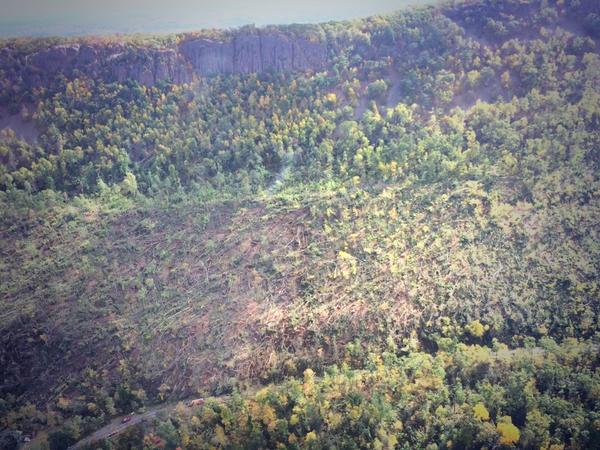
Photo courtesy Easthampton Police Department
How do we know this? For the reasons above. Aerial photos came in immediately, letting us see the pattern of tree damage (all blasted down in the same direction). We can visually inspect without even going there. The radar scan as it was happening clearly showed a downburst. There was no rotation at all. It's getting to the point where the only purpose of a NWS survey (and it's still a very good/valid one) is to calculate the exact area impacted and how fast the wind speeds were. In many cases, you already know the rest.
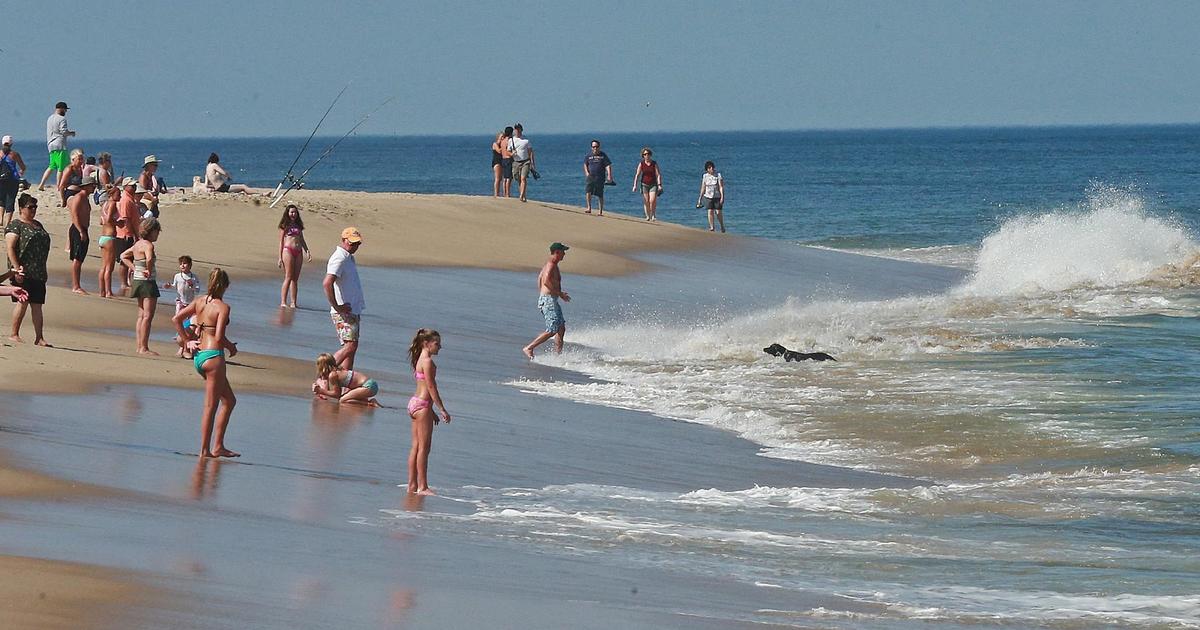
Radar scan at the time of the Revere tornado in July 2014. A hook echo, strong gate-to-gate shear, and a TDS on the correlation coefficient (bottom left) image. All you needed to do was look at this as a Meteorologist and know that a tornado, without a doubt, touched down.
This also happened during the Revere tornado. There was some blow-back toward Meteorologists who said it was a slam dunk tornado. "How do you know? There's no survey done yet!" was the common refrain. Well the survey gave us a great idea of the number of impacted homes, path, etc. But the TDS (tornado debris signature) on dual-pol radar confirmed it as soon as it happened. There was no doubt - radar can confirm a tornado now. There was no reason to go all day wondering if it was or wasn't - because there was no way it was anything else. A TDS, co-located with strong rotation on radar, tells us there must be a tornado on the ground.
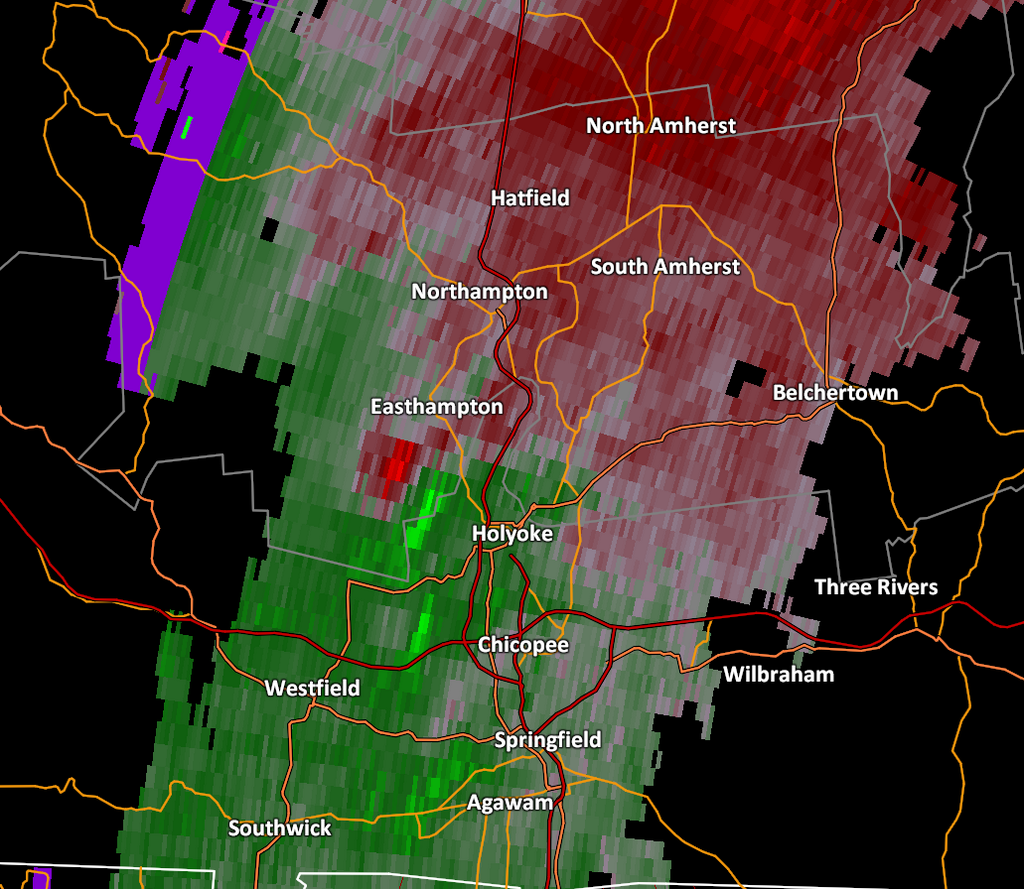
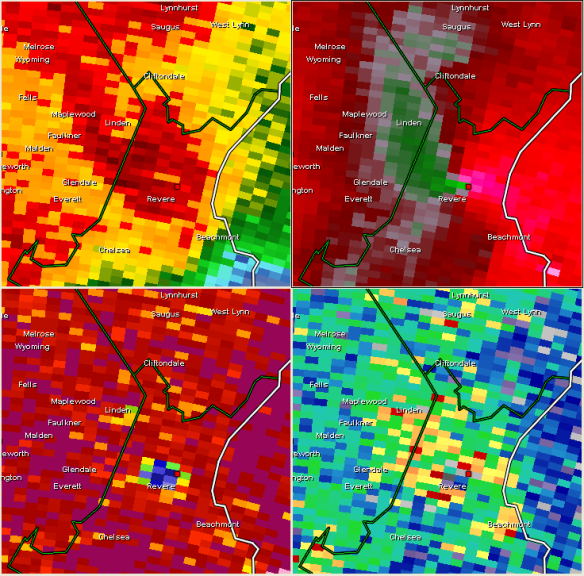
Velocity scan at 4:50am Wednesday morning. Source: NWS Taunton
Looking at today's event - there was a clear downburst signature. The image captured had diverging winds - winds moving opposite of each other. The red is outbound (away from the radar) and the green is inbound (toward the radar). The radar site is in Taunton, and so from there you can figure out which way that wind was flowing. Essentially, you had a blast of strong wind, but it was not rotating. The downburst was likely enhanced by its path along the side of Mt. Tom. The downslope momentum likely helped boost wind speeds to their 100mph max. Otherwise, speeds that high would have been hard to generate. We didn't have winds that strong aloft to channel down to the surface Wednesday morning.
Bottom line - trust the tech! I know that's a tall order when technology seems to give us grief all the time. But it IS possible to determine what has happened without waiting hours to confirm it. It is absolutely helpful, and at times critical, for trained NWS teams to continue surveying these scenes. Homes impacted, cars destroyed, areal coverage, are all key to the final report. And not to mention having a pair of eyes right there on the ground to see the full picture. But on the other side of the coin - these storms are less of a mystery than they ever have been before in human existence. Next stop: continuing research to increase tornado warning lead time and improve the verification to false alarm ratio! This is the next big step in severe weather forecasting.