Warmest October On Record Across Most Of New England
BOSTON (CBS) - If you're reading this on a frosty morning while heating up the car, it may come across as a little ironic.
But your current circumstance is totally normal for this time of year. The rest of the season, for the most part, has been a mild extended summer that's kept lawnmowers running and the T-shirts ready to go in the closet. As you might imagine, it's been setting some records.
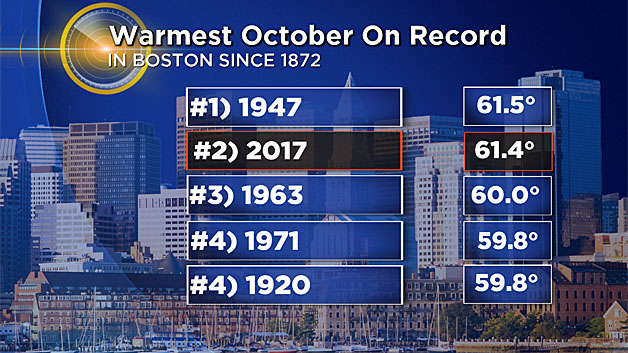
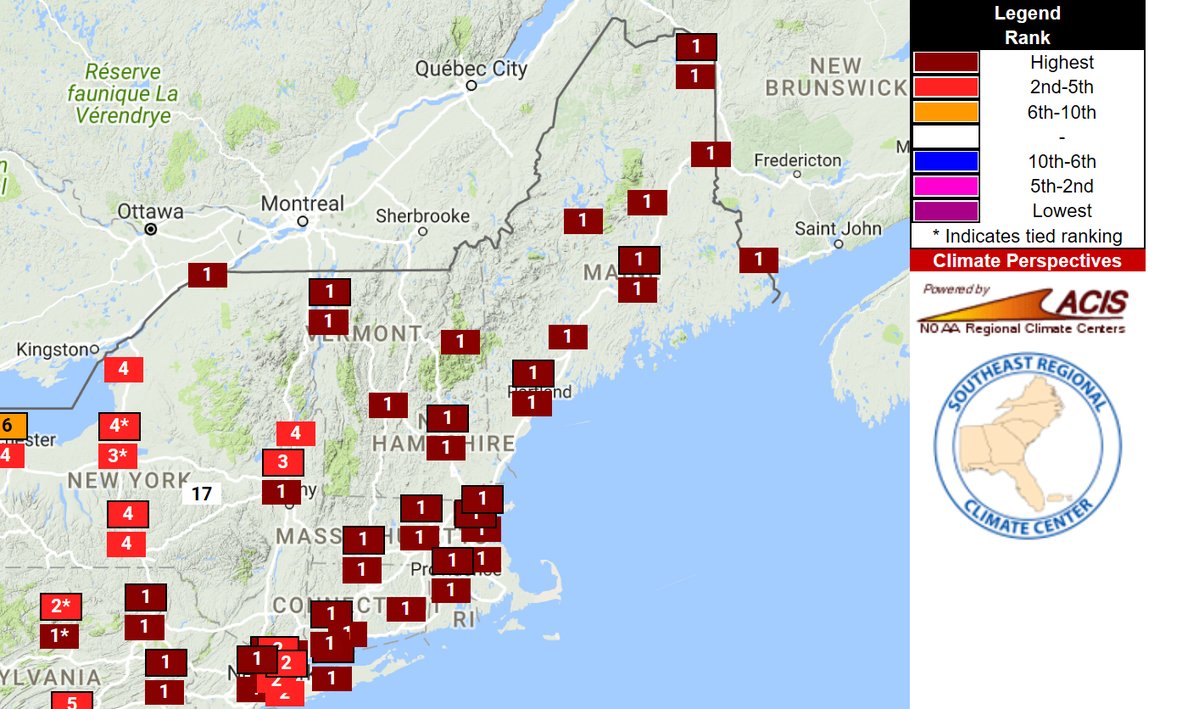
With the books just closed on October, we can now say it was the warmest such month on record across most of New England.
Cities like Portland, Worcester, Burlington, Caribou and Hartford, all closed above their previous records, with Boston just barely falling short of the top spot and coming in at second warmest.
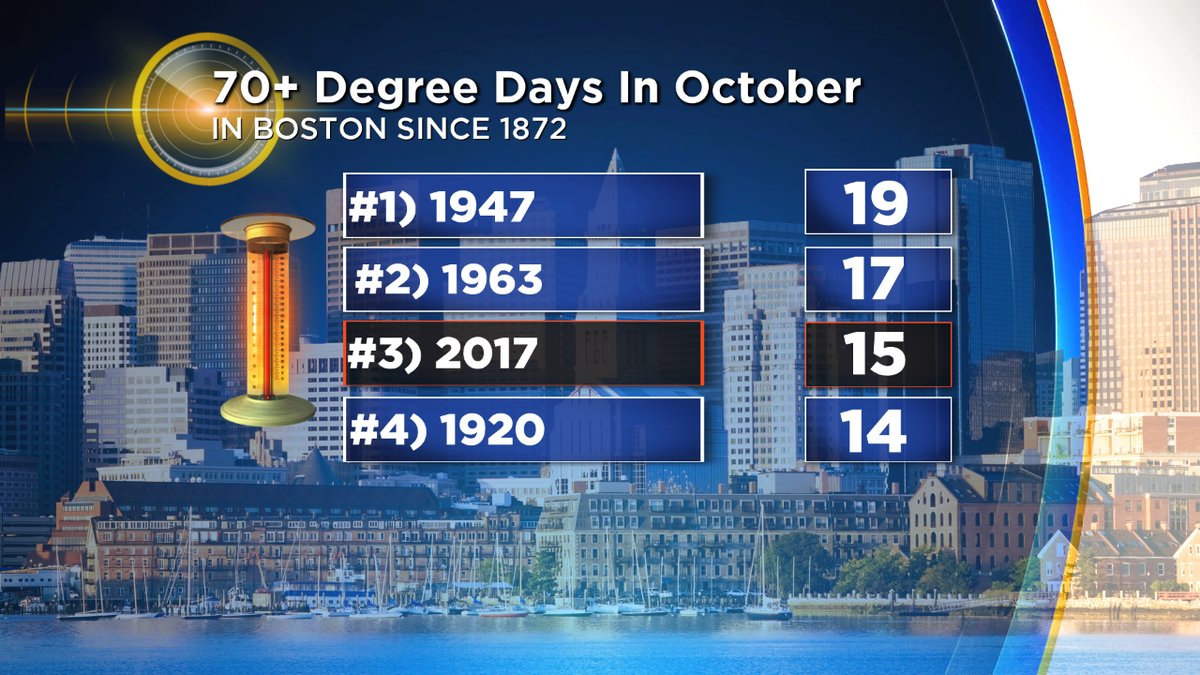
It was a month where we saw dew point records being set during tropical visits and some all-time warm monthly lows broken. Only 3 days managed to stay in the 50s, with 15 able to reach the 70s (3rd most on record in Boston).
We've gone 196 days since temperatures have reached the 30s in Boston, the 2nd longest such streak on record. You get the idea.
The climatological fall season runs Septemeber 1st through the end of November, and that too is on a record pace. Every location in New England has seen their warmest first two months of fall on record. This helped give us a very late foliage season, and likely played a hand in the amount of damage from this weekend's storm. Extra leaves over a larger area = more surface area for wind to blow on and bring trees down.
Is it an anomaly or a trend?
Undeniably the latter. I took a look back at Blue Hill Observatory's records, since I find it to be the best climate site in New England. They've been taking observations (real, live humans!) since 1885 and the site hasn't moved in that time. Even better, there are backups for all equipment to refine readings, and it's on top of a hill with no development nearby to potentially impact readings over time. Since it's a bit inland, it's less susceptible to odd ocean-breeze days than Logan Airport. It's the gold standard for weather information in the region.
Here's what the data shows.
October was the warmest on record for them, like most of the other New England sites. What really sticks though is how many of the records have been captured in recent years.
In this decade alone, just since 2010, the observatory has notched its warmest April, July, August, September, October, November, December, spring, summer, fall, winter, and year on record. Just a few months away from collecting the whole set. There are also many other Top 10 contenders set during recent times. Since the turn of the century, 40% of all top 10 warmest months have been accounted for (48 out of a possible 120 slots). And looking at years as a whole, the entire top 4 have been set this decade and 2017 is on pace to join that list as well. For comparison, there have been five top 10 coldest months since 2000. And for whole years, the only year in the top 50 coldest is 2003 (at #38).
(*You can search around for all sorts of this information here: http://xmacis.rcc-acis.org/ )
What does that all mean for us?
Well in many of these years, you aren't going to notice a huge difference in daily life. When we set a monthly record it's usually by a couple tenths of a degree. But the big picture is that a lot of tenths eventually gives you integers. Annual temperature has risen markedly since the 1800s, as is the trend globally. So even when we 'barely' set a new record, it's all part of the long term climb.
My favorite graphs from BHO are the ones that show this in a more real-life way, so to speak.
They also track 'ice out' dates and when the first blueberries ripen on the hill. These are more relatable things than raw numbers in a table. We can all understand a shift in climate in this manner - the backyard garden or how long the outdoor pond hockey season is. This information too shows the same story as the temperature statistics. A gradual warming of our region.
And because all of these end up with the question WHAT DOES IT MEAN FOR WINTER??
Here's a link to the post I wrote a few weeks ago on what warm falls typical portend for the following season!