How Does Blizzard Of 2013 Compare To Blizzard of 1978?
BOSTON (CBS) - It was Tuesday morning, February 5, and I was delivering my forecast on WBZ NewsRadio 1030.
Kicking off that 11:10 AM forecast with anchor Laurie Kirby, I stated that we were a little more than 72 hours away from a fascinating coincidence between the Blizzard of 1978 and the potential Blizzard of 2013.
Three days out and I was actually feeling quite confident about this impending storm of possible historical proportions.
It has come and gone and while there are some significant differences, there are also some amazing similarities between the two beasts.
Similarities:
Dates Of Action: February 6-7, 1978 & February 8-9, 2013.
Overall Snowfall Totals: 20-30" across much of the same broad area with much lower amounts on outer Cape Cod generally under 10".
Winds: Frequent gusts of 45-65 mph.
State Of Emergency: Declared in both blizzards.
Hardest Hit Towns For Coastal Damage: Revere, Hull, Scituate and Sandwich.
Satellite Imagery: Both blizzards looked like hurricanes with eye formations.

Differences:
Strike Days: Monday-Tuesday in 1978 vs. a Friday-Saturday in 2013. Impact was serious in 1978 as dire forecast was deemed unlikely by much of the skeptical public since its arrival was late. Many people went to work.
Road Closures: Ban on travel by Governor Dukakis in 1978 was too late resulting in thousands of vehicles stranded on major highways in the afternoon. In 2013, Governor Patrick recommended businesses and schools closed for the day and a ban on travel starting in mid-afternoon. This action resulted in clogged roads everywhere for days and days in 1978 vs. a more rapid cleanup and return to normal in 2013.
Snow Removal Equipment & Road Chemical Treatment: Both better in 2013 vs. 1978
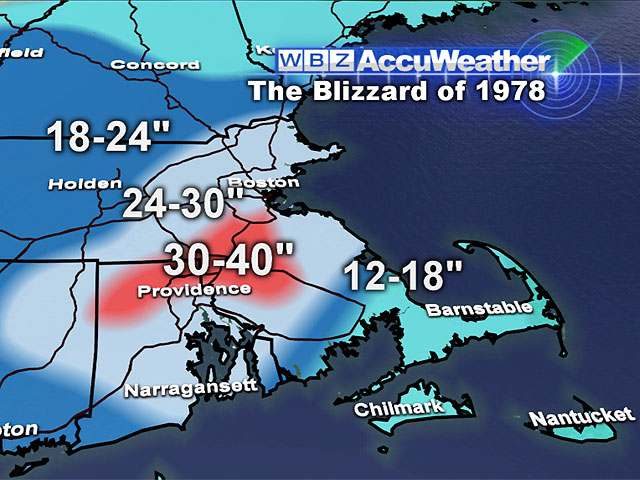
Snowfall Jackpot Zones: 30-40" over parts of ME Coast, southwestern NH, portions of central MA and south central CT in 2013 vs. 35-40" southwest of Boston into northern RI and 10-15" snow ME coast in 1978.
Peak Gusts: Higher in 1978 at 75-92 mph vs. 65-80 in 2013.
High Tides: 4 consecutive tides of 4-6 feet above normal with mountainous waves of 25-50 feet in 1978 vs. two consecutive tides of 2-4 feet above normal with seas of 15-25 feet in 2013. Flooding was major in all coastal areas in 1978.
Damage: 1978 estimates of nearly $2 billion (adjusted for inflation) vs. much less but unknown general dollar amount in 2013. More than 1900 homes were significantly damaged or destroyed in 1978 vs. much less devastation in 2013.
Lives Claimed: In 1978, 99 in MA & RI vs only a very few fatalities in 2013.
Preceding The Blizzards: The ground was bare in 2013 vs. some remaining snow in some areas north and west of Boston from a significant snowfall on January 20-21, 1978.
In the Record Books: 1978 is Boston's second greatest snowfall at 27.1" vs 2013 as the 5th greatest snowfall at 24.9".
Both blizzards were triggered by a lobe of tropical moisture and some energy in the southern branch of the jet stream merging with a bundle of increasing atmospheric spin in the northern branch of the jet stream.
The commingling and consolidating of these two features created rapidly intensifying ocean storms simultaneously feeding on the relatively warm ocean water and drawing on a supply of very cold air from Canada.
As linkage was initiated, the resultant strengthening circulations of both storms resulted in deceleration and a wobbling of the centers of low pressure.
For the Blizzard of 1978, the duration of stall was more than 24 hours compared to about 12 hours for the Blizzard of 2013. The latter storm was clearly more progressive.
On average, snowfall lasted about 6 fewer hours in 2013 vs. 1978.